


How we use AI to build a developer-first culture
08 Sep 2025
By: Tanuja Gupta Solutions Architect

In today’s data-driven world, businesses are constantly seeking new ways to harness the immense potential of their data. The integration of data mesh, data catalogs, and knowledge graphs is rapidly becoming a game-changer in data management, enabling organizations to unlock the true value of their data assets. In this blog post, we’ll explore these concepts through a real-world example of an e-commerce platform, demonstrating how each component plays a vital role in data management.
Let’s explore the connections between these three components and understand how each of them can aid us, using e-commerce sales as an example.
In our example, we’ll focus on a single product, “Product X,” and its sales and inventory data for three different branches: New Delhi, Mumbai, and Bengaluru. Here’s how data mesh, data catalogs, and knowledge graphs come into play
It promotes decentralized data ownership, with individual teams or domains taking responsibility for their data. This allows for greater agility, scalability, and more efficient management of data, all while ensuring data is democratized and accessible to those who need it.
New Delhi Branch (Data Mesh):
— Sales Data for “Product X” (New Delhi)
— Inventory Data for “Product X” (New Delhi)
Mumbai Branch (Data Mesh):
— Sales Data for “Product X” (Mumbai)
— Inventory Data for “Product X” (Mumbai)
Bengaluru Branch (Data Mesh):
— Sales Data for “Product X” (Bengaluru)
— Inventory Data for “Product X” (Bengaluru)
Data mesh ensures that each branch independently manages its sales and inventory data for “Product X.”
Data catalogs serve as the bridge between data mesh and the end-users. They act as a centralized repository, making data discoverable, accessible, and user-friendly. Users can easily search, find, and understand the data they require. Data catalogs also enable collaboration and data sharing across the organization, ensuring that data becomes a communal asset. This facilitates data democratization and empowers users to make data-driven decisions.
Data Catalog (Centralized):
— User-Friendly Search Interface
— Access to All Branches’ Sales Data for “Product X”
— Access to All Branches’ Inventory Data for “Product X”
The data catalog serves as a centralized repository where users across different branches can search for and find the sales and inventory data for “Product X” from all locations. This catalog allows teams from New Delhi, Mumbai, and Bengaluru to easily access and explore the data they need.
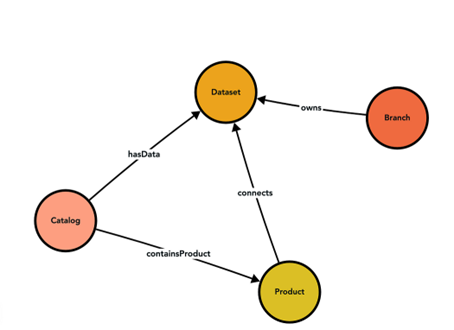
Knowledge graphs are the critical link that enriches the relationship between data mesh and data catalogs. They visually represent data relationships, providing context and depth to the data. By mapping out how different datasets interconnect, knowledge graphs create a holistic understanding of the data landscape. They facilitate efficient data discovery, metadata management, and data lineage tracing. Knowledge graphs are what make data truly understandable.
— “Product X” connects to “Sales Data” and “Inventory Data” in New Delhi
— “Product X” connects to “Sales Data” and “Inventory Data” in Mumbai
— “Product X” connects to “Sales Data” and “Inventory Data” in Bengaluru
The knowledge graph visually represents the interconnections. For example, it shows that “Product X” is linked to “Sales Data” and “Inventory Data” in each branch. It provides context, enabling users to understand how sales and inventory data for “Product X” are related in all locations.
Suppose the New Delhi branch experiences a sudden spike in sales of “Product X.” With the knowledge graph in place, the impact becomes evident. The graph shows how increased sales in New Delhi directly affect the local inventory levels. Simultaneously, it highlights the connections to sales and inventory data in Mumbai and Bengaluru, allowing predictive analysis and coordination across branches. Without the knowledge graph, understanding these data interdependencies would be far more challenging, making it difficult to respond effectively to changes in sales or inventory.
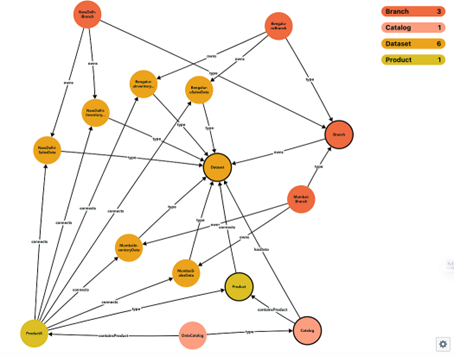
Consider the scenario of real-time inventory management. As data volumes grow, the task of monitoring inventory levels across numerous branches can grow increasingly intricate. However, this is precisely where the true potential of knowledge graphs comes into play.
With a knowledge graph in place, real-time inventory monitoring becomes a breeze. It allows you to observe inventory levels in real-time, uncover emerging patterns and trends, and make well-informed decisions. Now, envision an e-commerce platform expanding by adding new branches in various cities and introducing a broader spectrum of products. The beauty of the knowledge graph lies in its adaptability.
It seamlessly adjusts to these changes, new relationships between products, branches, and datasets. The result is a comprehensive perspective of the evolving data landscape, providing the insights needed to navigate the complexities of a growing e-commerce business.
At Scania, our data mesh architecture is already in full swing, driving our data strategy and integrations to new heights. As we continue to evolve, our focus is on enhancing the user experience and extracting maximum value from our data assets. To achieve this, we're exploring opportunities to integrate our data mesh with knowledge graphs (KGs). By harnessing the power of KGs, we aim to enrich our data ecosystem with semantic context, relationships, and insights, empowering our end users to make more informed decisions and derive deeper insights from our data. This integration will enable us to unlock new capabilities, improve data discovery and understanding, and drive innovation across our organization. We're excited about the possibilities that lie ahead as we leverage the synergy between our data mesh architecture and knowledge graphs to deliver even better outcomes for our users at Scania.
The synergy between data mesh, data catalogs, and knowledge graphs is changing the game in data management. Data mesh decentralizes data ownership, data catalogs make data accessible and user-friendly, and knowledge graphs bring depth and understanding to the data landscape. As organizations continue to grapple with vast and intricate datasets, these three components are essential for unlocking the true potential of data.